Millions Were Missing From America’s Flood Maps.
AI Made Them Visible.
Official flood maps cover only one-third of U.S. river channels. We trained a
deep-learning model on the places FEMA had mapped and used it to complete a
continuous 30-meter map of the lower 48—revealing 11 million people and
4.1 million buildings not represented in the national database.
For decades, the map stopped before the water did.
The United States began its national flood-insurance program in 1967.
More than half a century later, detailed federal studies cover only about
one-third of the country’s river channels. In 2023, more than 40% of
counties were still absent from the National Flood Hazard Layer, and only
one-quarter of its models had been updated within five years.
The bottleneck was not a lack of expertise. It was a production system
that could apply that expertise only one study at a time. Surveying and
modeling each river in detail takes specialist labor, money, and years
of review.
But floods don’t wait.We need a complete flood map.right now.
FEMA pattern Model-generated extent
02
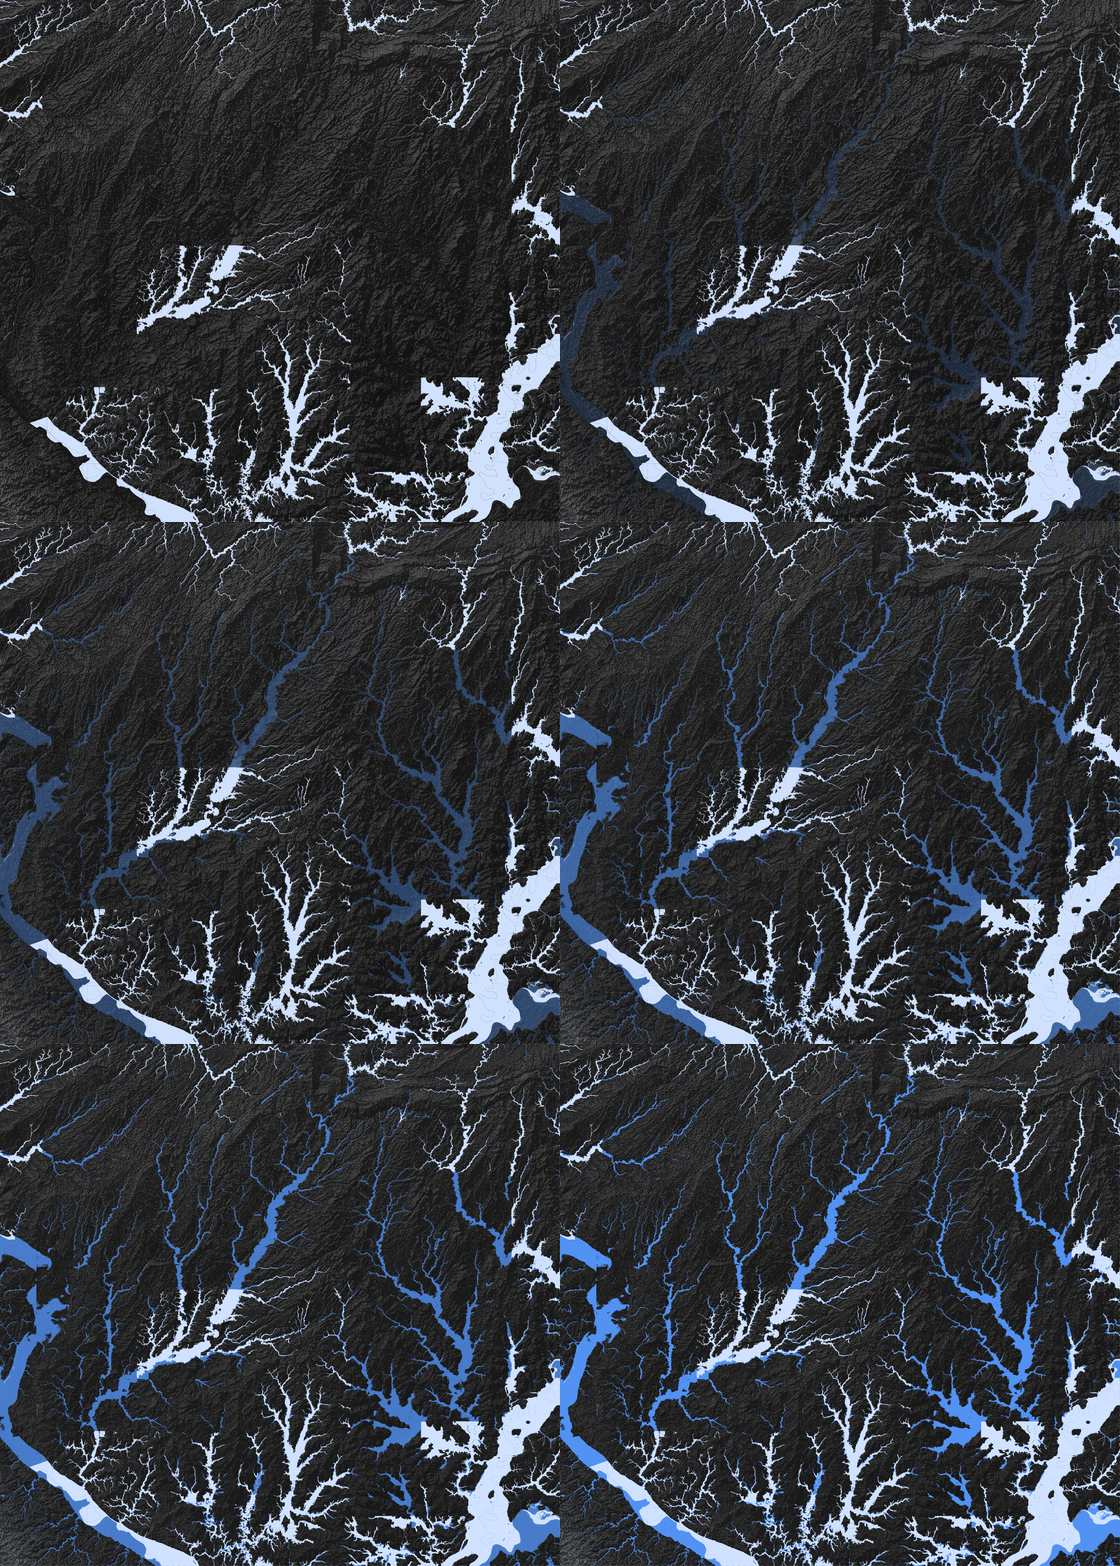
We taught a model to learn from the places FEMA had already mapped.
Existing FEMA flood patterns provide the training signal. Terrain provides
the physical context. The model learns the relationship between the two,
then estimates flood extent where detailed studies are missing.
Instead of commissioning a new engineering study for every river, the
method turns the country’s authoritative—but incomplete—record into a
reusable source of training data.
Then it completed the lower 48 at 30-meter resolution.
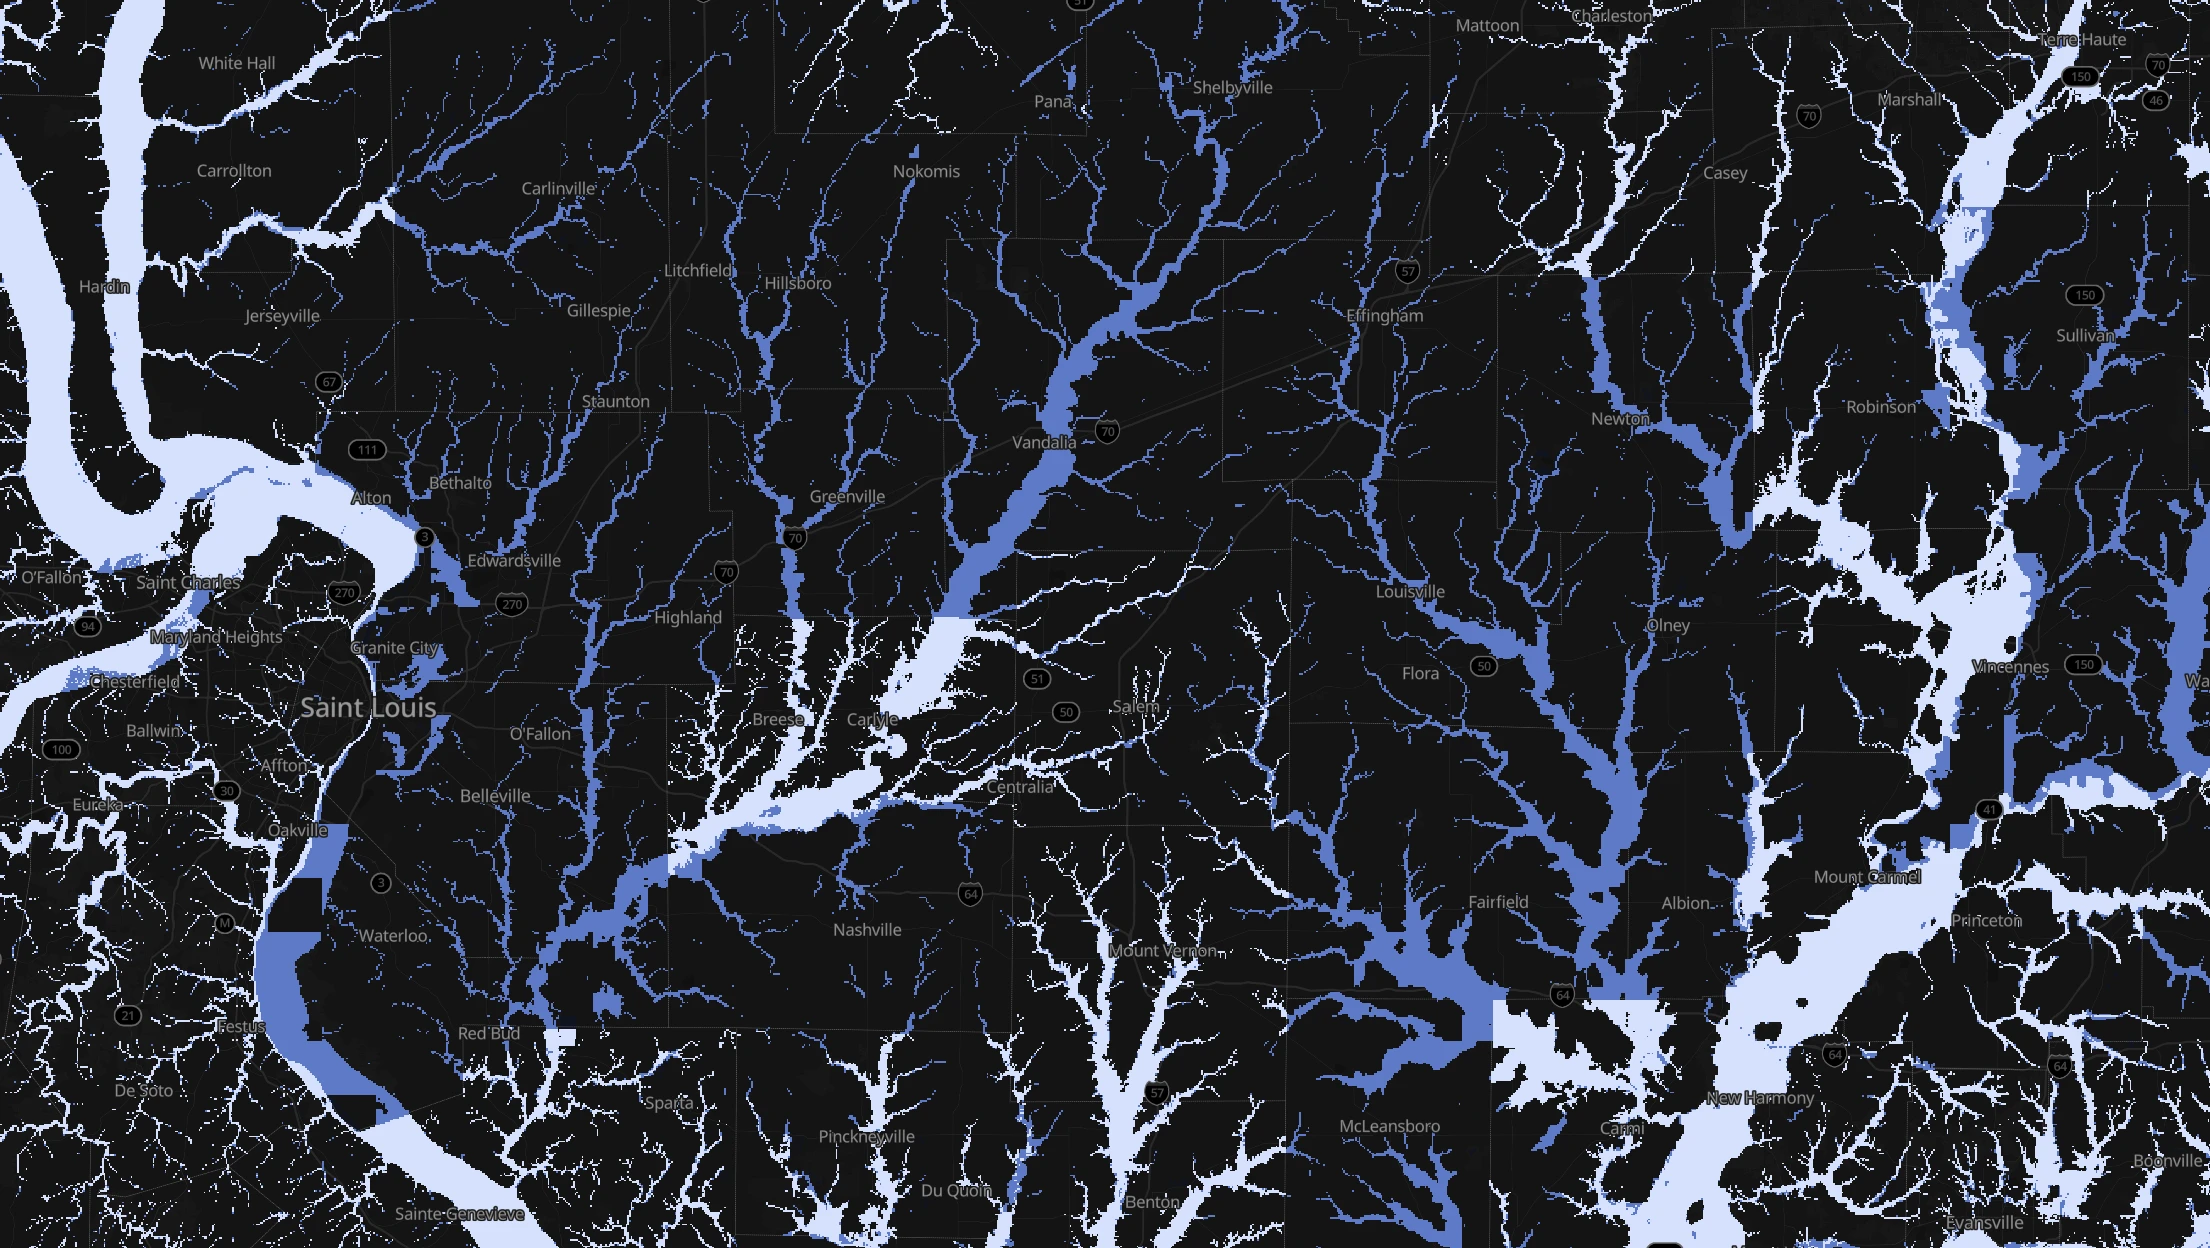
Pale blue shows FEMA’s published 100-year flood extent. Deep blue shows the
model-generated extent. Inspect where the official record ends and the model
continues.
Interactive map — drag to pan · use +/− or pinch to zoom · switch Overlay / Compare
The completed map revealed 11 million more people at risk.
FEMA’s national database places 16.06 million people and 5.07 million
buildings inside mapped 100-year flood zones. The completed map raises those
totals to 27.09 million people and 9.19 million buildings—69% and 81% more.
05
The omissions were not evenly distributed.
Some communities had detailed federal studies. Others had boundaries that
stopped at administrative lines—or virtually no official flood extent at all.
The model makes that uneven geography measurable.
40%of 917 urban areas were inadequately mapped
103had little or no FEMA coverage
06
The places left blank included more children and older adults.
Areas with little or no FEMA coverage had the highest median share of children
and older adults. But the pattern is not a simple rich-versus-poor divide:
areas completed by FEMA tended to have lower household incomes and higher
income inequality. Mapping priorities reflect several kinds of vulnerability.
07
Up close, missing maps take many forms.
St. Louis shows underestimated tributaries, Grand Rapids shows abrupt
administrative cutoffs, and Charlotte shows conservative boundaries and
shoreline omissions. Each map is interactive.
08
What took decades to map, a trained model extended in four hours.
FEMA’s national flood record is the product of more than half a century of
expert work, built within a federal program representing billions in public
investment. Our model does not replace that foundation. It learns from
it. Training took three days on a single consumer gaming GPU—not a
professional-grade accelerator. Once trained, inference across the lower 48
took four hours.
01
Decades of expert work
Authoritative maps were surveyed, negotiated, and assembled place by place.
→
02
Three days to learn
One consumer gaming GPU learned the relationship between expert-built flood patterns and terrain.
→
03
Four hours to extend
National inference generated a first pass across the remaining gaps.
This points to a new paradigm for data generation. The output is imperfect and non-regulatory, but machine intelligence can scale scarce expertise while people remain responsible for validation, exceptions, and decisions.
09
This map reveals missing information—it does not replace FEMA, yet.
This is a research product, not a regulatory map. Consult the FEMA Map Service Center for official decisions.
It represents fluvial and coastal 100-year flood extents and largely excludes rainfall-driven flooding.
The model estimates where flood extent may be missing; it does not establish parcel-level insurance requirements.