Compare FEMA coverage with the national model
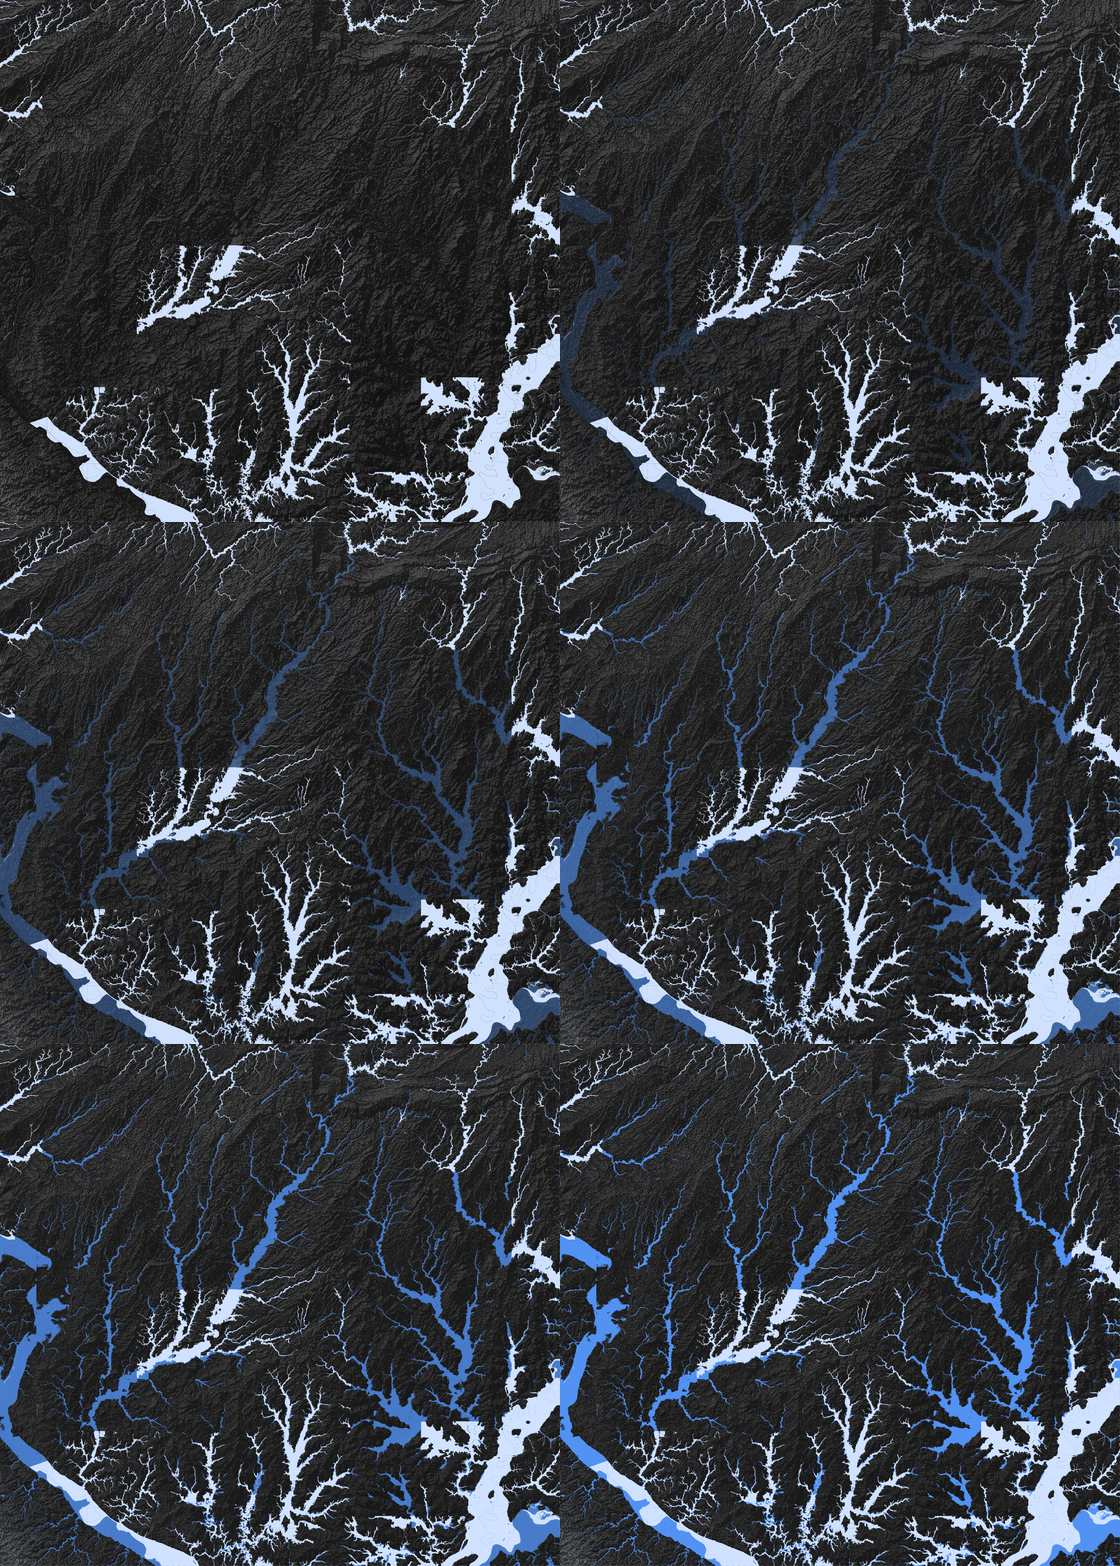
The light layer shows FEMA’s published 100-year flood extent; blue shows the model-estimated extent.
How the model fills the gaps
The model learns from FEMA’s current flood patterns and the surrounding terrain, then generates flood estimates for places without detailed maps.
Read the method in the paper →The national map reveals substantially more exposure
Estimated exposure rises from 16.06 to 27.09 million people, with 4.12 million additional buildings beyond FEMA’s published extent.
Largest population gaps
Miami and New York have the largest additional exposed populations; McAllen and Houma have almost no FEMA-mapped exposure.
Most undermapped metropolitan areas
Ranked by the share of exposed residents outside FEMA’s extent, among metropolitan areas with at least 10,000 exposed people.
What FEMA flood maps leave out
Compare FEMA and model-estimated extents across three cities.
- Shows fluvial and coastal 100-year flood extents; largely excludes rainfall-driven flooding.
- This is a research product, not a regulatory map. For official decisions, consult the FEMA Map Service Center.
- Accuracy varies by terrain (validation mIoU 0.48–0.54).